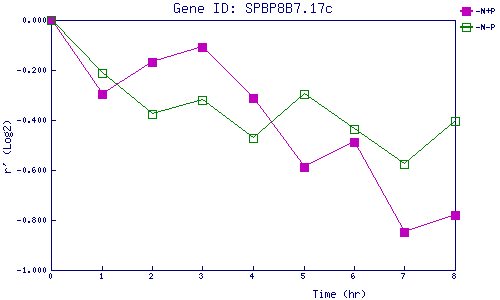
| 0 | 1 | 2 | 3 | 4 | 5 | 6 | 7 | 8 | |
| -N+P | 0.000 | -0.298 | -0.168 | -0.108 | -0.310 | -0.587 | -0.488 | -0.847 | -0.780 |
| -N-P | 0.000 | -0.212 | -0.376 | -0.319 | -0.472 | -0.298 | -0.437 | -0.577 | -0.405 |
|
-N+P: Nitrogen starved in the presence of P-factor -N-P: Nitrogen starved in the absence of P-factor |