| 0 | 1 | 2 | 3 | 4 | 5 | 6 | 7 | 8 | |
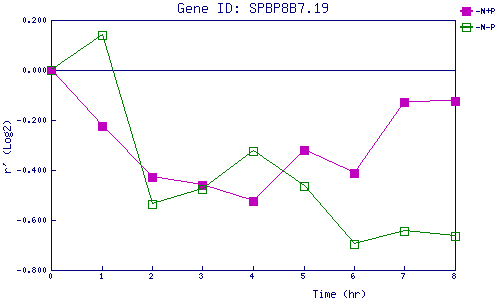
| -N+P | 0.000 | -0.225 | -0.427 | -0.460 | -0.523 | -0.320 | -0.413 | -0.130 | -0.124 |
| -N-P | 0.000 | 0.140 | -0.535 | -0.476 | -0.323 | -0.464 | -0.698 | -0.645 | -0.662 |
|
-N+P: Nitrogen starved in the presence of P-factor -N-P: Nitrogen starved in the absence of P-factor |