| 0 | 1 | 2 | 3 | 4 | 5 | 6 | 7 | 8 | |
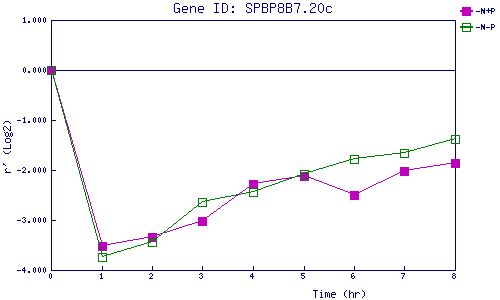
| -N+P | 0.000 | -3.517 | -3.341 | -3.029 | -2.271 | -2.126 | -2.491 | -2.015 | -1.867 |
| -N-P | 0.000 | -3.741 | -3.441 | -2.635 | -2.449 | -2.085 | -1.773 | -1.657 | -1.382 |
|
-N+P: Nitrogen starved in the presence of P-factor -N-P: Nitrogen starved in the absence of P-factor |