reserved_name_ubp3
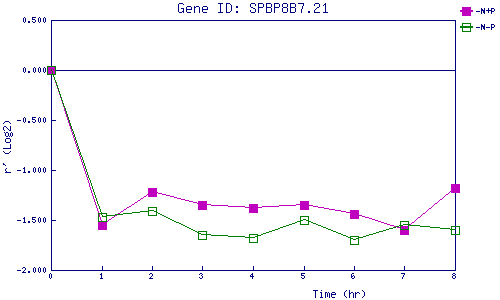
| 0 | 1 | 2 | 3 | 4 | 5 | 6 | 7 | 8 | |
| -N+P | 0.000 | -1.546 | -1.222 | -1.353 | -1.378 | -1.346 | -1.444 | -1.602 | -1.177 |
| -N-P | 0.000 | -1.470 | -1.406 | -1.649 | -1.680 | -1.500 | -1.701 | -1.546 | -1.599 |
|
-N+P: Nitrogen starved in the presence of P-factor -N-P: Nitrogen starved in the absence of P-factor |