erd2
| 0 | 1 | 2 | 3 | 4 | 5 | 6 | 7 | 8 | |
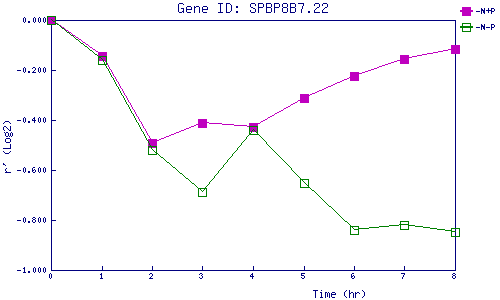
| -N+P | 0.000 | -0.145 | -0.491 | -0.411 | -0.429 | -0.312 | -0.225 | -0.157 | -0.117 |
| -N-P | 0.000 | -0.158 | -0.521 | -0.690 | -0.440 | -0.651 | -0.842 | -0.819 | -0.848 |
|
-N+P: Nitrogen starved in the presence of P-factor -N-P: Nitrogen starved in the absence of P-factor |