cyp4
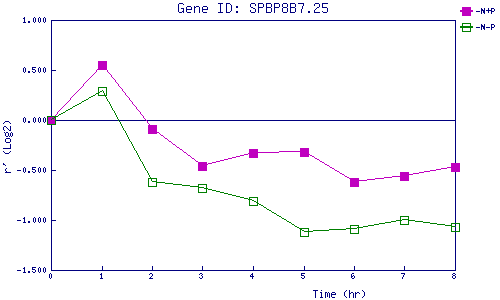
| 0 | 1 | 2 | 3 | 4 | 5 | 6 | 7 | 8 | |
| -N+P | 0.000 | 0.548 | -0.090 | -0.456 | -0.326 | -0.320 | -0.615 | -0.563 | -0.468 |
| -N-P | 0.000 | 0.291 | -0.617 | -0.676 | -0.808 | -1.115 | -1.094 | -0.995 | -1.070 |
|
-N+P: Nitrogen starved in the presence of P-factor -N-P: Nitrogen starved in the absence of P-factor |