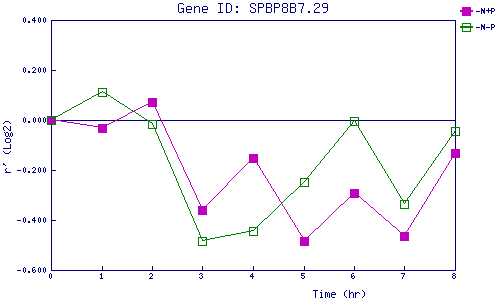
| 0 | 1 | 2 | 3 | 4 | 5 | 6 | 7 | 8 | |
| -N+P | 0.000 | -0.034 | 0.074 | -0.359 | -0.152 | -0.483 | -0.291 | -0.463 | -0.133 |
| -N-P | 0.000 | 0.114 | -0.015 | -0.485 | -0.444 | -0.249 | -0.004 | -0.335 | -0.045 |
|
-N+P: Nitrogen starved in the presence of P-factor -N-P: Nitrogen starved in the absence of P-factor |