| 0 | 1 | 2 | 3 | 4 | 5 | 6 | 7 | 8 | |
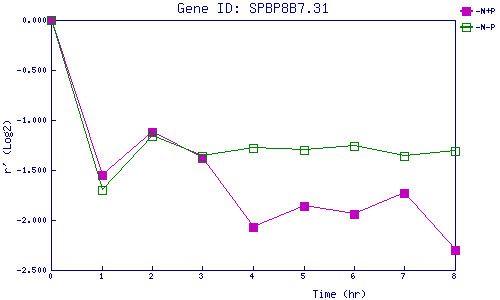
| -N+P | 0.000 | -1.551 | -1.117 | -1.385 | -2.071 | -1.859 | -1.937 | -1.731 | -2.295 |
| -N-P | 0.000 | -1.700 | -1.159 | -1.356 | -1.279 | -1.302 | -1.265 | -1.365 | -1.311 |
|
-N+P: Nitrogen starved in the presence of P-factor -N-P: Nitrogen starved in the absence of P-factor |