| 0 | 1 | 2 | 3 | 4 | 5 | 6 | 7 | 8 | |
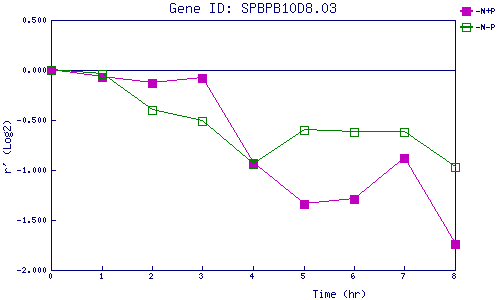
| -N+P | 0.000 | -0.068 | -0.132 | -0.085 | -0.932 | -1.336 | -1.292 | -0.881 | -1.737 |
| -N-P | 0.000 | -0.035 | -0.399 | -0.510 | -0.939 | -0.604 | -0.623 | -0.621 | -0.969 |
|
-N+P: Nitrogen starved in the presence of P-factor -N-P: Nitrogen starved in the absence of P-factor |