| 0 | 1 | 2 | 3 | 4 | 5 | 6 | 7 | 8 | |
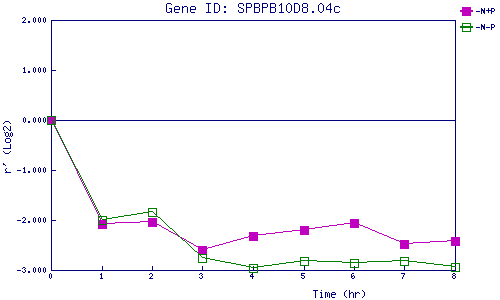
| -N+P | 0.000 | -2.073 | -2.048 | -2.591 | -2.327 | -2.193 | -2.058 | -2.481 | -2.416 |
| -N-P | 0.000 | -1.996 | -1.831 | -2.766 | -2.962 | -2.821 | -2.860 | -2.826 | -2.938 |
|
-N+P: Nitrogen starved in the presence of P-factor -N-P: Nitrogen starved in the absence of P-factor |