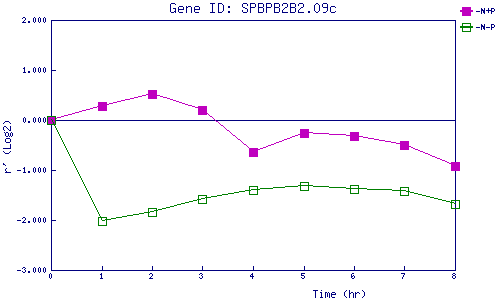
| 0 | 1 | 2 | 3 | 4 | 5 | 6 | 7 | 8 | |
| -N+P | 0.000 | 0.290 | 0.517 | 0.208 | -0.647 | -0.263 | -0.322 | -0.508 | -0.910 |
| -N-P | 0.000 | -2.028 | -1.838 | -1.578 | -1.406 | -1.313 | -1.371 | -1.413 | -1.684 |
|
-N+P: Nitrogen starved in the presence of P-factor -N-P: Nitrogen starved in the absence of P-factor |