gpt1
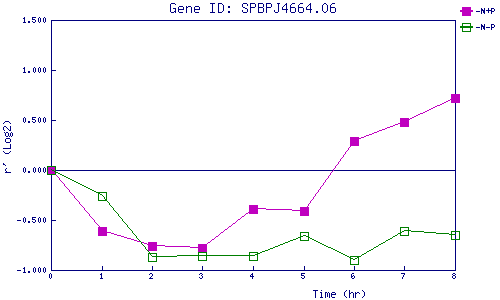
| 0 | 1 | 2 | 3 | 4 | 5 | 6 | 7 | 8 | |
| -N+P | 0.000 | -0.607 | -0.763 | -0.781 | -0.391 | -0.413 | 0.293 | 0.475 | 0.717 |
| -N-P | 0.000 | -0.261 | -0.874 | -0.858 | -0.858 | -0.661 | -0.904 | -0.611 | -0.647 |
|
-N+P: Nitrogen starved in the presence of P-factor -N-P: Nitrogen starved in the absence of P-factor |