rpb6 rpo15
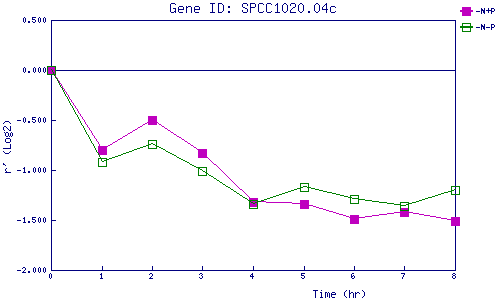
| 0 | 1 | 2 | 3 | 4 | 5 | 6 | 7 | 8 | |
| -N+P | 0.000 | -0.800 | -0.501 | -0.829 | -1.322 | -1.344 | -1.488 | -1.423 | -1.508 |
| -N-P | 0.000 | -0.920 | -0.744 | -1.011 | -1.345 | -1.173 | -1.289 | -1.365 | -1.202 |
|
-N+P: Nitrogen starved in the presence of P-factor -N-P: Nitrogen starved in the absence of P-factor |