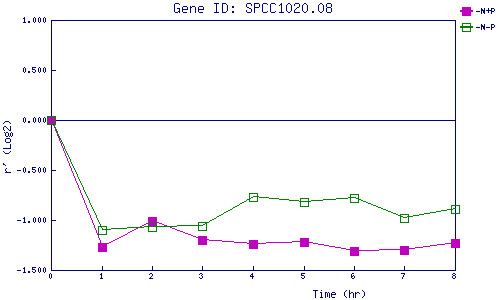
| 0 | 1 | 2 | 3 | 4 | 5 | 6 | 7 | 8 | |
| -N+P | 0.000 | -1.274 | -1.009 | -1.202 | -1.238 | -1.220 | -1.313 | -1.305 | -1.227 |
| -N-P | 0.000 | -1.099 | -1.068 | -1.061 | -0.770 | -0.824 | -0.777 | -0.981 | -0.887 |
|
-N+P: Nitrogen starved in the presence of P-factor -N-P: Nitrogen starved in the absence of P-factor |