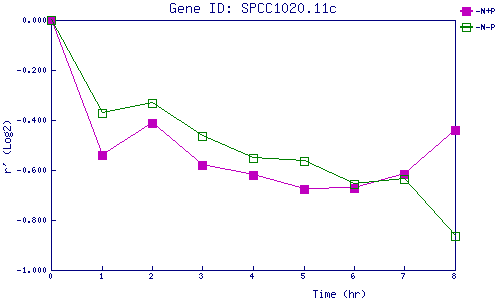
| 0 | 1 | 2 | 3 | 4 | 5 | 6 | 7 | 8 | |
| -N+P | 0.000 | -0.541 | -0.412 | -0.581 | -0.619 | -0.675 | -0.670 | -0.616 | -0.440 |
| -N-P | 0.000 | -0.371 | -0.331 | -0.466 | -0.554 | -0.565 | -0.656 | -0.637 | -0.866 |
|
-N+P: Nitrogen starved in the presence of P-factor -N-P: Nitrogen starved in the absence of P-factor |