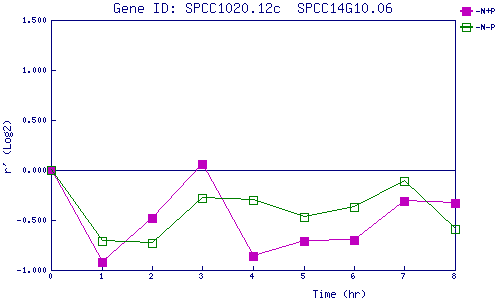
| 0 | 1 | 2 | 3 | 4 | 5 | 6 | 7 | 8 | |
| -N+P | 0.000 | -0.917 | -0.476 | 0.064 | -0.863 | -0.706 | -0.699 | -0.314 | -0.332 |
| -N-P | 0.000 | -0.712 | -0.728 | -0.284 | -0.303 | -0.466 | -0.372 | -0.112 | -0.586 |
|
-N+P: Nitrogen starved in the presence of P-factor -N-P: Nitrogen starved in the absence of P-factor |