Tf2-12 tf2-5
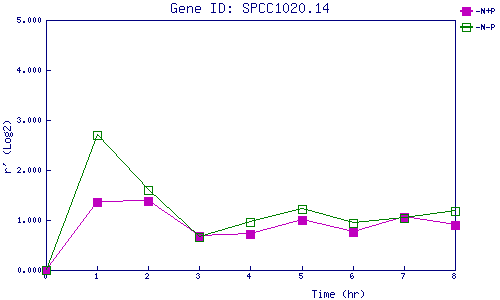
| 0 | 1 | 2 | 3 | 4 | 5 | 6 | 7 | 8 | |
| -N+P | 0.000 | 1.365 | 1.381 | 0.677 | 0.718 | 0.991 | 0.758 | 1.065 | 0.906 |
| -N-P | 0.000 | 2.706 | 1.603 | 0.658 | 0.957 | 1.227 | 0.945 | 1.032 | 1.173 |
|
-N+P: Nitrogen starved in the presence of P-factor -N-P: Nitrogen starved in the absence of P-factor |
