prp11
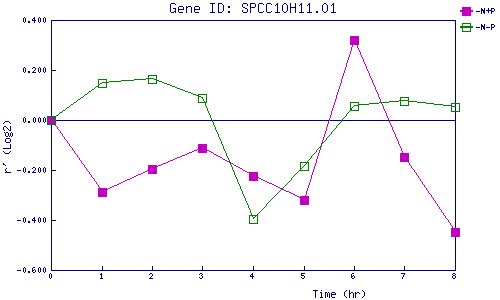
| 0 | 1 | 2 | 3 | 4 | 5 | 6 | 7 | 8 | |
| -N+P | 0.000 | -0.289 | -0.195 | -0.114 | -0.222 | -0.320 | 0.319 | -0.149 | -0.448 |
| -N-P | 0.000 | 0.148 | 0.163 | 0.087 | -0.397 | -0.182 | 0.055 | 0.076 | 0.053 |
|
-N+P: Nitrogen starved in the presence of P-factor -N-P: Nitrogen starved in the absence of P-factor |