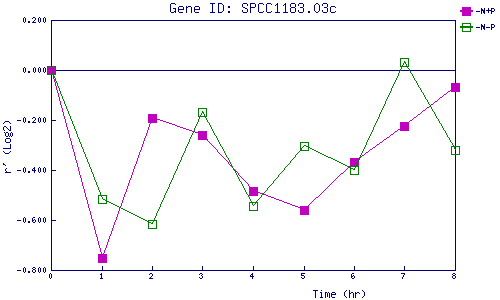
| 0 | 1 | 2 | 3 | 4 | 5 | 6 | 7 | 8 | |
| -N+P | 0.000 | -0.754 | -0.194 | -0.260 | -0.483 | -0.560 | -0.369 | -0.223 | -0.068 |
| -N-P | 0.000 | -0.516 | -0.616 | -0.168 | -0.544 | -0.303 | -0.399 | 0.034 | -0.320 |
|
-N+P: Nitrogen starved in the presence of P-factor -N-P: Nitrogen starved in the absence of P-factor |