| 0 | 1 | 2 | 3 | 4 | 5 | 6 | 7 | 8 | |
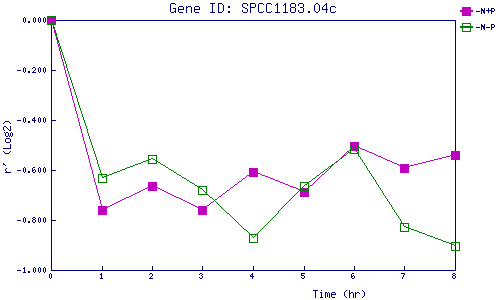
| -N+P | 0.000 | -0.759 | -0.665 | -0.760 | -0.606 | -0.687 | -0.503 | -0.591 | -0.541 |
| -N-P | 0.000 | -0.634 | -0.556 | -0.681 | -0.872 | -0.666 | -0.515 | -0.828 | -0.905 |
|
-N+P: Nitrogen starved in the presence of P-factor -N-P: Nitrogen starved in the absence of P-factor |