ung1
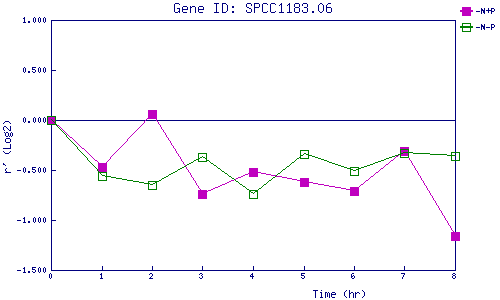
| 0 | 1 | 2 | 3 | 4 | 5 | 6 | 7 | 8 | |
| -N+P | 0.000 | -0.468 | 0.055 | -0.744 | -0.517 | -0.624 | -0.713 | -0.308 | -1.158 |
| -N-P | 0.000 | -0.557 | -0.649 | -0.372 | -0.738 | -0.343 | -0.508 | -0.332 | -0.365 |
|
-N+P: Nitrogen starved in the presence of P-factor -N-P: Nitrogen starved in the absence of P-factor |