| 0 | 1 | 2 | 3 | 4 | 5 | 6 | 7 | 8 | |
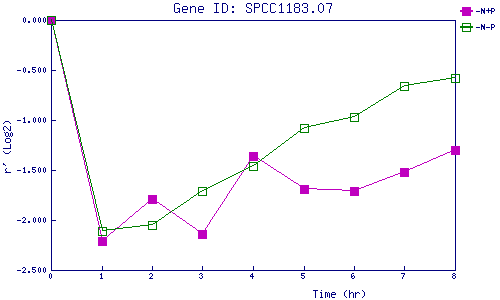
| -N+P | 0.000 | -2.211 | -1.788 | -2.144 | -1.360 | -1.686 | -1.710 | -1.520 | -1.299 |
| -N-P | 0.000 | -2.108 | -2.051 | -1.707 | -1.465 | -1.084 | -0.973 | -0.663 | -0.584 |
|
-N+P: Nitrogen starved in the presence of P-factor -N-P: Nitrogen starved in the absence of P-factor |