rpl1-1 rpl10a-1 rpl101
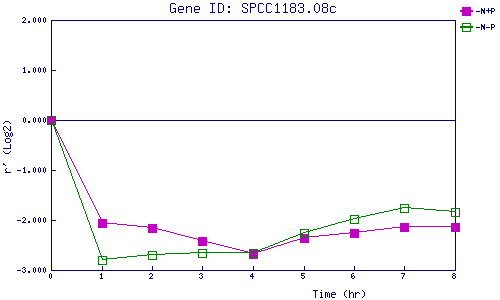
| 0 | 1 | 2 | 3 | 4 | 5 | 6 | 7 | 8 | |
| -N+P | 0.000 | -2.057 | -2.153 | -2.428 | -2.689 | -2.362 | -2.260 | -2.138 | -2.143 |
| -N-P | 0.000 | -2.797 | -2.700 | -2.664 | -2.666 | -2.256 | -1.986 | -1.754 | -1.832 |
|
-N+P: Nitrogen starved in the presence of P-factor -N-P: Nitrogen starved in the absence of P-factor |