wtf7 wtf10
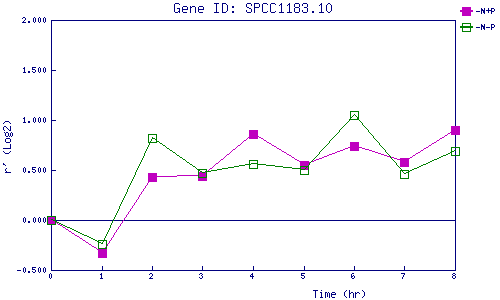
| 0 | 1 | 2 | 3 | 4 | 5 | 6 | 7 | 8 | |
| -N+P | 0.000 | -0.327 | 0.428 | 0.442 | 0.861 | 0.551 | 0.741 | 0.575 | 0.903 |
| -N-P | 0.000 | -0.241 | 0.819 | 0.470 | 0.562 | 0.497 | 1.047 | 0.455 | 0.686 |
|
-N+P: Nitrogen starved in the presence of P-factor -N-P: Nitrogen starved in the absence of P-factor |