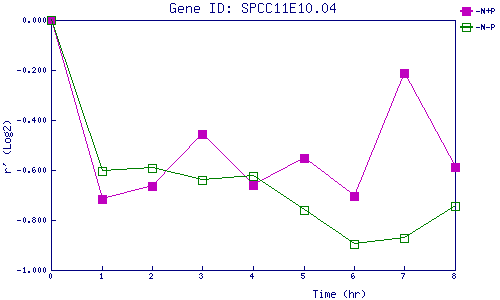
| 0 | 1 | 2 | 3 | 4 | 5 | 6 | 7 | 8 | |
| -N+P | 0.000 | -0.717 | -0.663 | -0.457 | -0.661 | -0.551 | -0.702 | -0.212 | -0.588 |
| -N-P | 0.000 | -0.604 | -0.591 | -0.641 | -0.623 | -0.758 | -0.897 | -0.872 | -0.742 |
|
-N+P: Nitrogen starved in the presence of P-factor -N-P: Nitrogen starved in the absence of P-factor |