| 0 | 1 | 2 | 3 | 4 | 5 | 6 | 7 | 8 | |
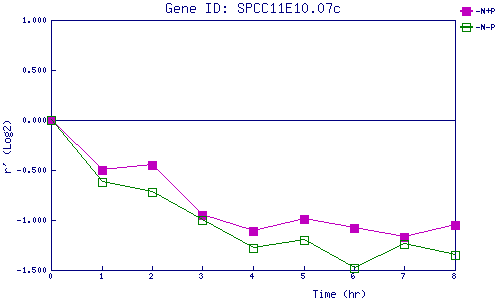
| -N+P | 0.000 | -0.498 | -0.449 | -0.950 | -1.110 | -0.987 | -1.084 | -1.166 | -1.052 |
| -N-P | 0.000 | -0.624 | -0.722 | -1.004 | -1.281 | -1.201 | -1.482 | -1.242 | -1.352 |
|
-N+P: Nitrogen starved in the presence of P-factor -N-P: Nitrogen starved in the absence of P-factor |