rik1
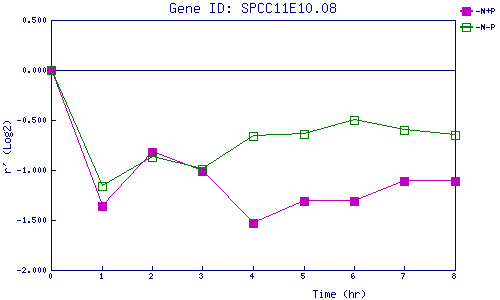
| 0 | 1 | 2 | 3 | 4 | 5 | 6 | 7 | 8 | |
| -N+P | 0.000 | -1.362 | -0.818 | -1.014 | -1.533 | -1.312 | -1.307 | -1.107 | -1.107 |
| -N-P | 0.000 | -1.165 | -0.866 | -0.994 | -0.655 | -0.643 | -0.495 | -0.603 | -0.646 |
|
-N+P: Nitrogen starved in the presence of P-factor -N-P: Nitrogen starved in the absence of P-factor |