| 0 | 1 | 2 | 3 | 4 | 5 | 6 | 7 | 8 | |
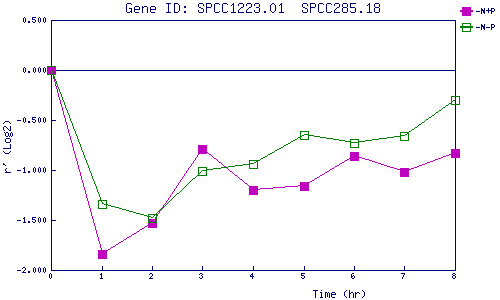
| -N+P | 0.000 | -1.839 | -1.528 | -0.788 | -1.204 | -1.155 | -0.864 | -1.019 | -0.834 |
| -N-P | 0.000 | -1.344 | -1.475 | -1.011 | -0.939 | -0.649 | -0.727 | -0.664 | -0.302 |
|
-N+P: Nitrogen starved in the presence of P-factor -N-P: Nitrogen starved in the absence of P-factor |