thi3 nmt1
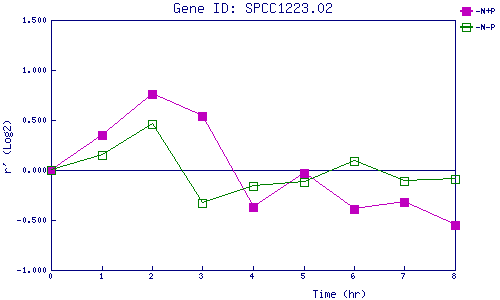
| 0 | 1 | 2 | 3 | 4 | 5 | 6 | 7 | 8 | |
| -N+P | 0.000 | 0.346 | 0.759 | 0.539 | -0.374 | -0.030 | -0.391 | -0.319 | -0.546 |
| -N-P | 0.000 | 0.149 | 0.459 | -0.331 | -0.161 | -0.121 | 0.091 | -0.109 | -0.089 |
|
-N+P: Nitrogen starved in the presence of P-factor -N-P: Nitrogen starved in the absence of P-factor |