gut2
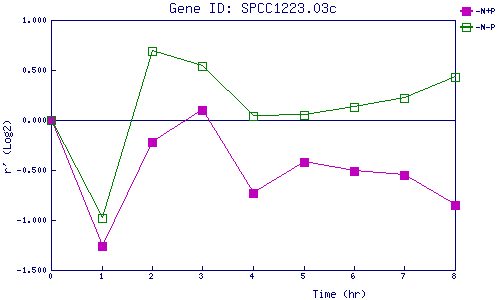
| 0 | 1 | 2 | 3 | 4 | 5 | 6 | 7 | 8 | |
| -N+P | 0.000 | -1.260 | -0.225 | 0.098 | -0.733 | -0.416 | -0.506 | -0.548 | -0.850 |
| -N-P | 0.000 | -0.985 | 0.688 | 0.539 | 0.044 | 0.052 | 0.127 | 0.220 | 0.427 |
|
-N+P: Nitrogen starved in the presence of P-factor -N-P: Nitrogen starved in the absence of P-factor |