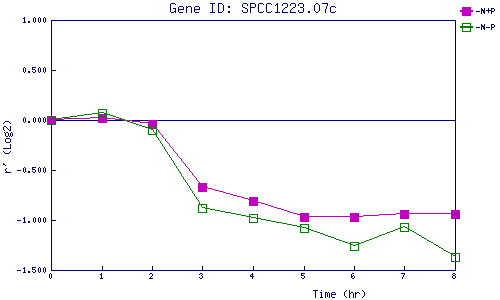
| 0 | 1 | 2 | 3 | 4 | 5 | 6 | 7 | 8 | |
| -N+P | 0.000 | 0.017 | -0.045 | -0.670 | -0.812 | -0.966 | -0.966 | -0.945 | -0.942 |
| -N-P | 0.000 | 0.067 | -0.100 | -0.880 | -0.982 | -1.084 | -1.265 | -1.074 | -1.374 |
|
-N+P: Nitrogen starved in the presence of P-factor -N-P: Nitrogen starved in the absence of P-factor |