dfr1
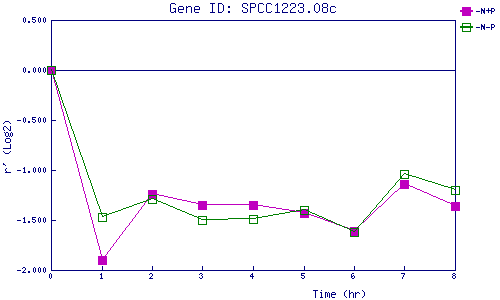
| 0 | 1 | 2 | 3 | 4 | 5 | 6 | 7 | 8 | |
| -N+P | 0.000 | -1.901 | -1.237 | -1.354 | -1.349 | -1.433 | -1.609 | -1.139 | -1.358 |
| -N-P | 0.000 | -1.466 | -1.294 | -1.505 | -1.489 | -1.404 | -1.623 | -1.035 | -1.203 |
|
-N+P: Nitrogen starved in the presence of P-factor -N-P: Nitrogen starved in the absence of P-factor |