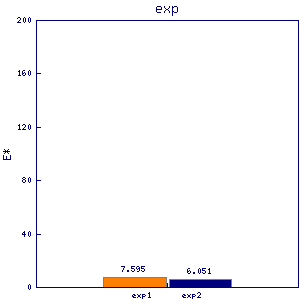
ptc2
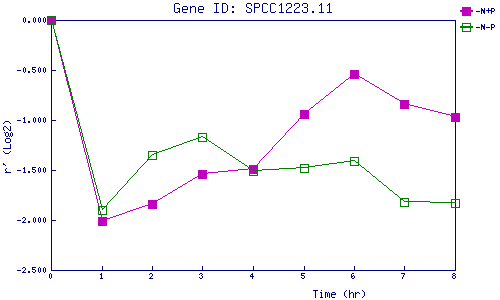
| 0 | 1 | 2 | 3 | 4 | 5 | 6 | 7 | 8 | |
| -N+P | 0.000 | -2.012 | -1.838 | -1.543 | -1.488 | -0.942 | -0.539 | -0.835 | -0.971 |
| -N-P | 0.000 | -1.900 | -1.348 | -1.173 | -1.511 | -1.477 | -1.406 | -1.820 | -1.830 |
|
-N+P: Nitrogen starved in the presence of P-factor -N-P: Nitrogen starved in the absence of P-factor |