bio2
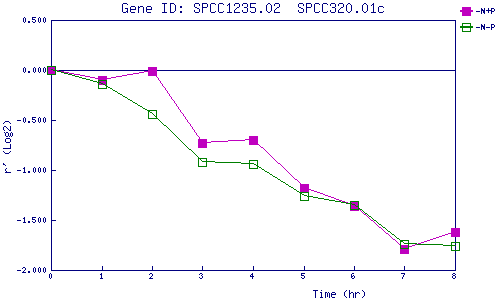
| 0 | 1 | 2 | 3 | 4 | 5 | 6 | 7 | 8 | |
| -N+P | 0.000 | -0.095 | -0.014 | -0.729 | -0.699 | -1.185 | -1.363 | -1.791 | -1.617 |
| -N-P | 0.000 | -0.139 | -0.438 | -0.920 | -0.935 | -1.265 | -1.348 | -1.739 | -1.756 |
|
-N+P: Nitrogen starved in the presence of P-factor -N-P: Nitrogen starved in the absence of P-factor |