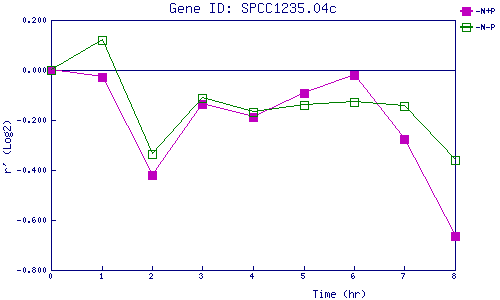
| 0 | 1 | 2 | 3 | 4 | 5 | 6 | 7 | 8 | |
| -N+P | 0.000 | -0.027 | -0.421 | -0.138 | -0.188 | -0.092 | -0.019 | -0.277 | -0.662 |
| -N-P | 0.000 | 0.120 | -0.335 | -0.111 | -0.169 | -0.141 | -0.129 | -0.144 | -0.362 |
|
-N+P: Nitrogen starved in the presence of P-factor -N-P: Nitrogen starved in the absence of P-factor |