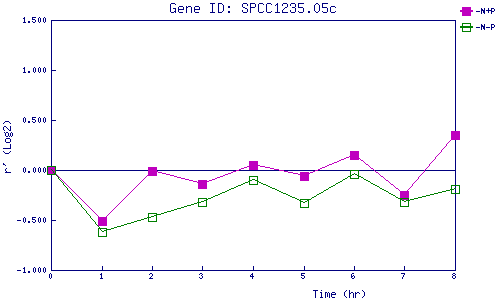
| 0 | 1 | 2 | 3 | 4 | 5 | 6 | 7 | 8 | |
| -N+P | 0.000 | -0.510 | -0.014 | -0.141 | 0.053 | -0.059 | 0.149 | -0.249 | 0.346 |
| -N-P | 0.000 | -0.618 | -0.469 | -0.323 | -0.101 | -0.332 | -0.042 | -0.315 | -0.189 |
|
-N+P: Nitrogen starved in the presence of P-factor -N-P: Nitrogen starved in the absence of P-factor |