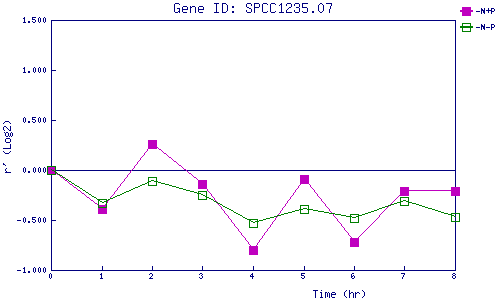
| 0 | 1 | 2 | 3 | 4 | 5 | 6 | 7 | 8 | |
| -N+P | 0.000 | -0.390 | 0.262 | -0.135 | -0.802 | -0.086 | -0.724 | -0.212 | -0.211 |
| -N-P | 0.000 | -0.332 | -0.111 | -0.253 | -0.527 | -0.390 | -0.485 | -0.309 | -0.467 |
|
-N+P: Nitrogen starved in the presence of P-factor -N-P: Nitrogen starved in the absence of P-factor |