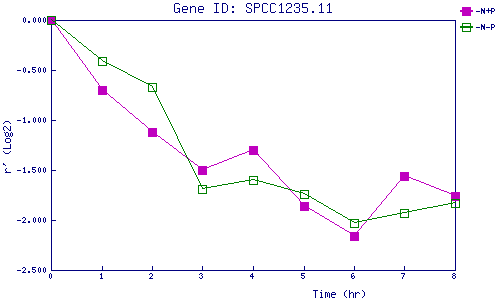
| 0 | 1 | 2 | 3 | 4 | 5 | 6 | 7 | 8 | |
| -N+P | 0.000 | -0.700 | -1.119 | -1.502 | -1.296 | -1.856 | -2.163 | -1.563 | -1.756 |
| -N-P | 0.000 | -0.410 | -0.670 | -1.688 | -1.604 | -1.741 | -2.031 | -1.927 | -1.829 |
|
-N+P: Nitrogen starved in the presence of P-factor -N-P: Nitrogen starved in the absence of P-factor |