ght6 meu12
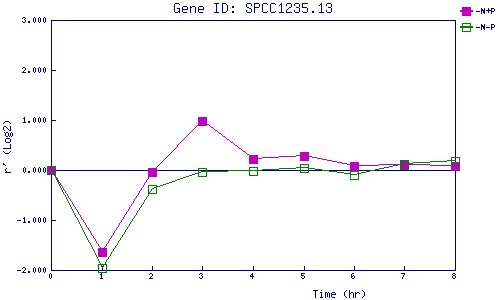
| 0 | 1 | 2 | 3 | 4 | 5 | 6 | 7 | 8 | |
| -N+P | 0.000 | -1.646 | -0.038 | 0.983 | 0.225 | 0.290 | 0.083 | 0.105 | 0.076 |
| -N-P | 0.000 | -1.951 | -0.386 | -0.031 | -0.025 | 0.036 | -0.099 | 0.129 | 0.183 |
|
-N+P: Nitrogen starved in the presence of P-factor -N-P: Nitrogen starved in the absence of P-factor |