rps18-2 rps1802
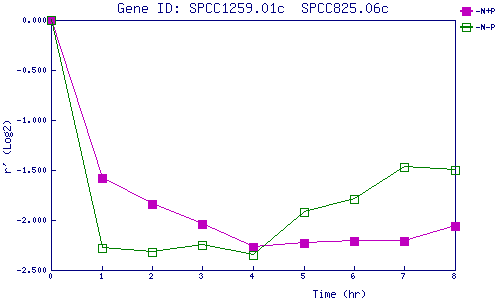
| 0 | 1 | 2 | 3 | 4 | 5 | 6 | 7 | 8 | |
| -N+P | 0.000 | -1.584 | -1.843 | -2.040 | -2.269 | -2.229 | -2.208 | -2.213 | -2.060 |
| -N-P | 0.000 | -2.278 | -2.318 | -2.253 | -2.353 | -1.922 | -1.788 | -1.474 | -1.501 |
|
-N+P: Nitrogen starved in the presence of P-factor -N-P: Nitrogen starved in the absence of P-factor |