rpa12
| 0 | 1 | 2 | 3 | 4 | 5 | 6 | 7 | 8 | |
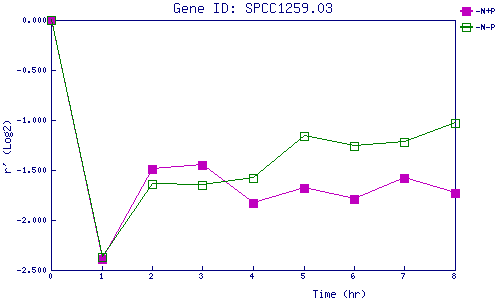
| -N+P | 0.000 | -2.389 | -1.489 | -1.448 | -1.830 | -1.680 | -1.791 | -1.581 | -1.726 |
| -N-P | 0.000 | -2.366 | -1.639 | -1.650 | -1.586 | -1.159 | -1.259 | -1.223 | -1.032 |
|
-N+P: Nitrogen starved in the presence of P-factor -N-P: Nitrogen starved in the absence of P-factor |