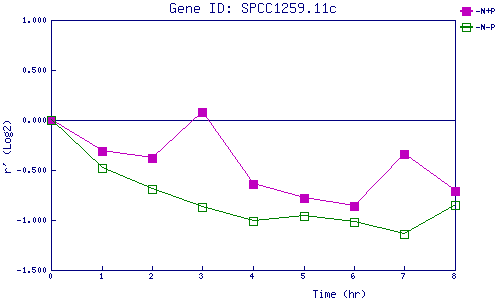
| 0 | 1 | 2 | 3 | 4 | 5 | 6 | 7 | 8 | |
| -N+P | 0.000 | -0.314 | -0.377 | 0.076 | -0.642 | -0.782 | -0.865 | -0.340 | -0.713 |
| -N-P | 0.000 | -0.475 | -0.687 | -0.866 | -1.010 | -0.962 | -1.025 | -1.139 | -0.847 |
|
-N+P: Nitrogen starved in the presence of P-factor -N-P: Nitrogen starved in the absence of P-factor |
