chk1 rad27
| 0 | 1 | 2 | 3 | 4 | 5 | 6 | 7 | 8 | |
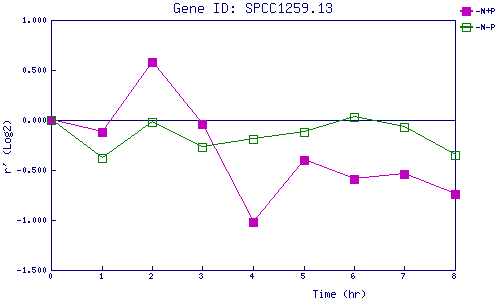
| -N+P | 0.000 | -0.118 | 0.576 | -0.043 | -1.022 | -0.405 | -0.592 | -0.541 | -0.745 |
| -N-P | 0.000 | -0.376 | -0.016 | -0.267 | -0.191 | -0.119 | 0.034 | -0.070 | -0.346 |
|
-N+P: Nitrogen starved in the presence of P-factor -N-P: Nitrogen starved in the absence of P-factor |
