meu27
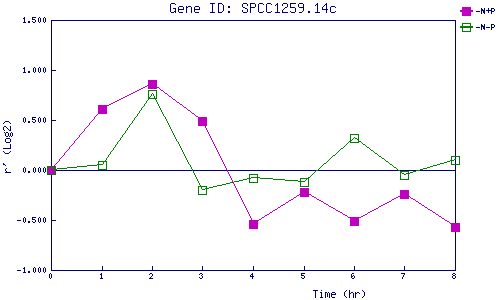
| 0 | 1 | 2 | 3 | 4 | 5 | 6 | 7 | 8 | |
| -N+P | 0.000 | 0.614 | 0.858 | 0.493 | -0.539 | -0.217 | -0.512 | -0.243 | -0.573 |
| -N-P | 0.000 | 0.048 | 0.760 | -0.196 | -0.079 | -0.116 | 0.320 | -0.049 | 0.099 |
|
-N+P: Nitrogen starved in the presence of P-factor -N-P: Nitrogen starved in the absence of P-factor |