| 0 | 1 | 2 | 3 | 4 | 5 | 6 | 7 | 8 | |
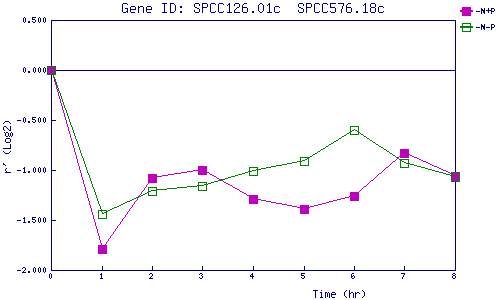
| -N+P | 0.000 | -1.786 | -1.083 | -0.998 | -1.290 | -1.387 | -1.257 | -0.831 | -1.064 |
| -N-P | 0.000 | -1.436 | -1.211 | -1.157 | -1.007 | -0.907 | -0.596 | -0.930 | -1.066 |
|
-N+P: Nitrogen starved in the presence of P-factor -N-P: Nitrogen starved in the absence of P-factor |