pku70
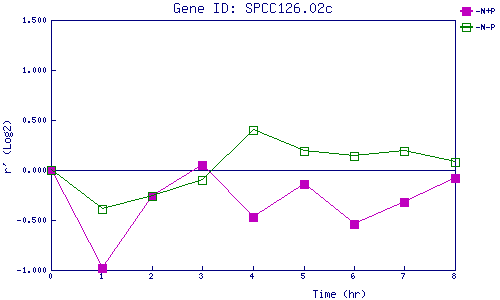
| 0 | 1 | 2 | 3 | 4 | 5 | 6 | 7 | 8 | |
| -N+P | 0.000 | -0.980 | -0.255 | 0.051 | -0.466 | -0.140 | -0.536 | -0.322 | -0.083 |
| -N-P | 0.000 | -0.390 | -0.260 | -0.101 | 0.397 | 0.194 | 0.138 | 0.187 | 0.083 |
|
-N+P: Nitrogen starved in the presence of P-factor -N-P: Nitrogen starved in the absence of P-factor |