lps1
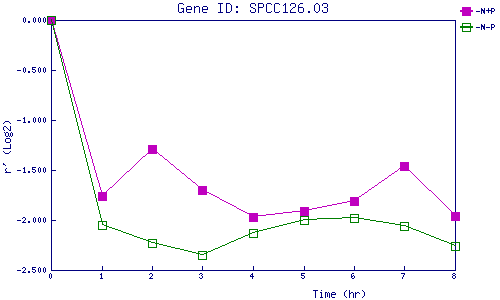
| 0 | 1 | 2 | 3 | 4 | 5 | 6 | 7 | 8 | |
| -N+P | 0.000 | -1.757 | -1.287 | -1.696 | -1.973 | -1.913 | -1.808 | -1.461 | -1.959 |
| -N-P | 0.000 | -2.053 | -2.230 | -2.349 | -2.134 | -2.003 | -1.979 | -2.056 | -2.265 |
|
-N+P: Nitrogen starved in the presence of P-factor -N-P: Nitrogen starved in the absence of P-factor |