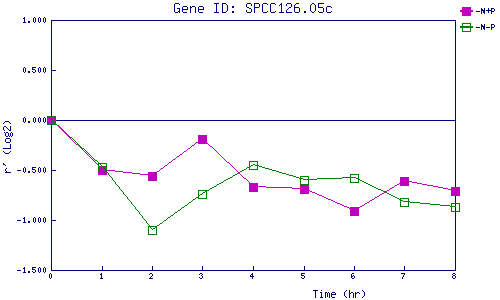
| 0 | 1 | 2 | 3 | 4 | 5 | 6 | 7 | 8 | |
| -N+P | 0.000 | -0.495 | -0.555 | -0.187 | -0.667 | -0.694 | -0.912 | -0.606 | -0.709 |
| -N-P | 0.000 | -0.468 | -1.097 | -0.741 | -0.452 | -0.600 | -0.577 | -0.818 | -0.873 |
|
-N+P: Nitrogen starved in the presence of P-factor -N-P: Nitrogen starved in the absence of P-factor |