iah1
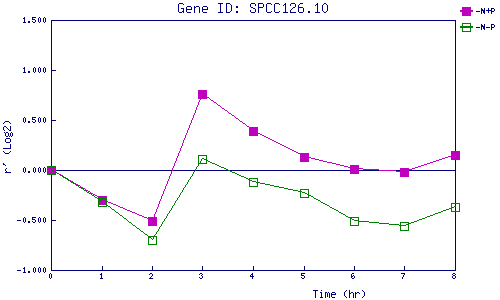
| 0 | 1 | 2 | 3 | 4 | 5 | 6 | 7 | 8 | |
| -N+P | 0.000 | -0.303 | -0.510 | 0.755 | 0.393 | 0.126 | 0.013 | -0.017 | 0.149 |
| -N-P | 0.000 | -0.315 | -0.697 | 0.107 | -0.116 | -0.226 | -0.509 | -0.557 | -0.368 |
|
-N+P: Nitrogen starved in the presence of P-factor -N-P: Nitrogen starved in the absence of P-factor |