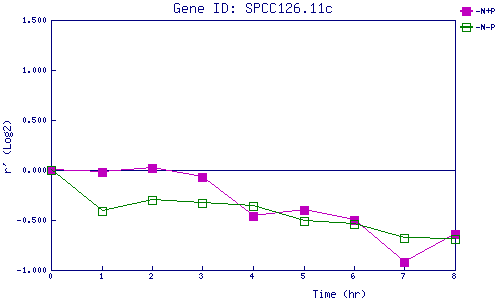
| 0 | 1 | 2 | 3 | 4 | 5 | 6 | 7 | 8 | |
| -N+P | 0.000 | -0.024 | 0.018 | -0.066 | -0.464 | -0.403 | -0.495 | -0.915 | -0.644 |
| -N-P | 0.000 | -0.412 | -0.297 | -0.334 | -0.362 | -0.508 | -0.542 | -0.675 | -0.688 |
|
-N+P: Nitrogen starved in the presence of P-factor -N-P: Nitrogen starved in the absence of P-factor |